Will UK house prices crash in 2023?
Will UK house prices crash in 2023? Analysts have predicted a price crash for 2023, even similar to the price crash after the 2007 financial crisis. But it has not happened yet.
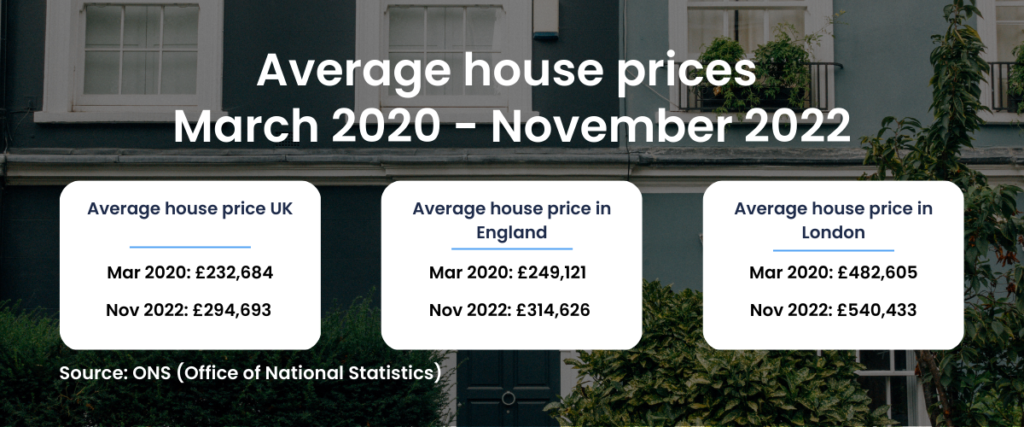
Property investors, home buyers, and homeowners wonder if house prices will crash in 2023. This is after the average house price in the UK peaked at £294,693 this past November 2022.
To discuss the UK housing market, our initial focus will be on examining the key indices that track property prices. This will provide us with insight into information related to house price trends. We will then look into the main factors influencing house prices and what to expect in 2023.
House price data and indices
We will cover six respected data sources that release information about house prices. The indices are based on house sales, mortgage approvals, and property listings. The summary below provides an overview of each index.
Based on completed sales covering the UK:
- The UK House Price Index, Land Registry Data.
Based on mortgage approvals:
- Nationwide Price Index, Mortgage Approvals Data.
- Halifax Price Index, Mortgage Approvals Data
Based on the average asking prices for properties advertised:
- Rightmove Price Index, Listed House Purchase Price.
UK House Price Index
Based on actual completed sales covering the whole of the United Kingdom. Includes mortgage and cash transactions and is the most accurate house price index in the UK. The index uses various government sources to gather data, including HM Land Registry and other government agencies. The latest available data was released in March 2023.
Nationwide Price Index
It is calculated based on its own data of mortgage approvals covering the whole of the United Kingdom. It is less accurate than the UK House Price Index because it does not cover cash sales transactions. According to Oliver Knight, a residential research associate at Knight Frank, cash transactions make up around 30% of transactions.
Halifax Price Index
It is calculated based on its own database of mortgage approvals covering the whole of the United Kingdom. It uses a larger sample size than Nationwide Price Index and a weighting system based on 1983. The results of this methodology can be more volatile.
Rightmove Price Index
The index is calculated based on the average asking prices for properties advertised on the Rightmove portal. The index only covers England and Wales. The data reflects the sellers’ asking price but does not consider the selling price or if the properties were sold.
Comparison of house price indices
The table below compares the different indices with their main advantages and disadvantages.
| Index | Category | Data Recorded | Advantages | Disadvantages |
| UK House Price Index | House sale index | When the sale is registered | More accurate than other indices. Largest sample size. Allows to understand house prices at a more local level. | The reports are based on two-month-old data. The index may not be as helpful if you are looking for the most up-to-date prices to buy or sell. |
| Nationwide Price Index | Mortgage approval index | When the mortgage is approved | Up-to-date data | Does not include cash sales. Smaller sample size. |
| Halifax Price Index | Mortgage approval index | When the mortgage is approved | Up-to-date data | Does not include cash sales. Methodology can result in more volatile results. |
| Rightmove Price Index | Property listing index | When the house is advertised on the portal | Most timely Big sample size compared to other property portals. | A good reflection of seller’s sentiment but not as accurate. |
The impact of the 2007–2008 financial crisis on House Prices
House prices increased rapidly in the previous years leading to 2007. The average UK house price reached a peak of £190,032 in September 2007. Easy credit availability and rising demand from first-time buyers were the main drivers of price growth.
The global financial crisis began in late 2007. House prices fell by nearly 20% between August 2007 and April 2009.
The financial crisis led to tightening mortgage lending requirements, making mortgages harder to obtain. Its impact is still relevant to understanding the UK house price growth today. Mainly because of the monetary policies and mortgage lending restrictions introduced.
Low borrowing costs
The events of the financial crisis in 2007 marked the start of near-zero interest rates. The aim was to increase the money supply and encourage bank lending and investment.
Very low base rates persisted for over a decade. During this time, borrowers received help from exceptionally low interest rates that allowed them to buy more expensive properties.
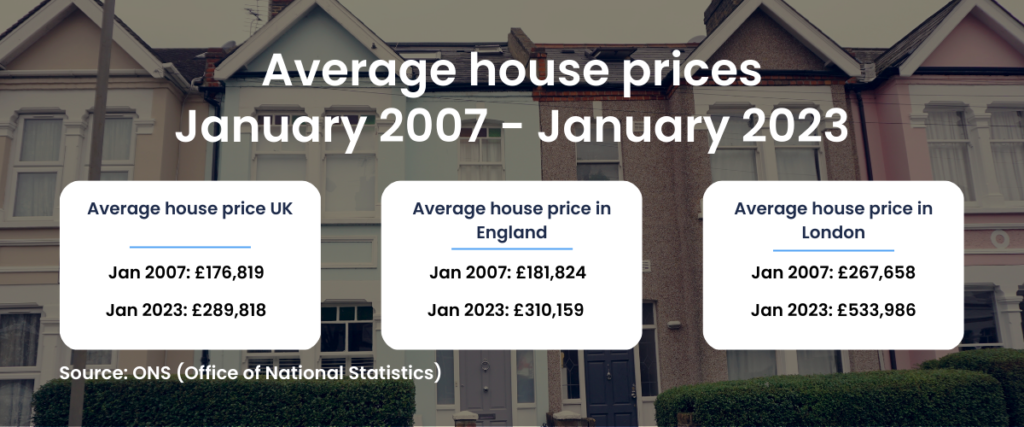
After a period of stagnation between 2010 and 2012, the average house price in England rose by nearly 71%. By March 2023, the average house price is £289,818 in the UK.
Higher Stress-testing of mortgage affordability
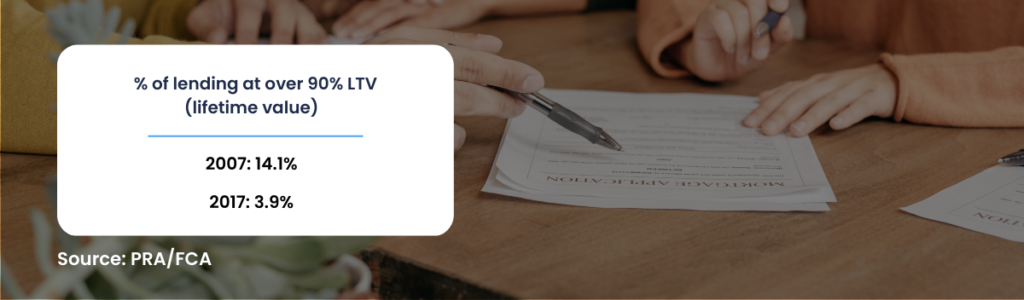
To prevent another debt-driven housing market boom, tighter restrictions on mortgage lending and regulation measures made mortgages harder to obtain.
Over the past few years, borrowers showed solid financial positions, with higher credit scores and savings than average. This contrasts sharply with people targeted with mortgages before the financial crisis.
The impact of the Covid-19 pandemic on UK house prices
Economic activity was unprecedentedly constrained by the Covid-19 pandemic and the measures put in place to contain it. Unlike in most recessions, house prices in the UK boomed throughout the pandemic. This went against what many analysts predicted as it goes against historical records.
In England, the average house price increased by 14% in 2021. In 2022, there was the fastest annual growth since late 2004. House price growth reached a 13% increase in June compared to the previous year.
This extraordinary growth was supported by measures introduced to help the broader economy during the pandemic. Including loosening the monetary policy environment and fiscal measures such as the furlough or Coronavirus Job Retention Scheme. As well as direct support to the market with the temporary reduction in Stamp Duty Land Tax.
The Bank of England attributed nearly 50% of this price growth to changes in household preferences. The changes were especially around property type and location.
Outlook for UK house prices in 2023
There are several factors affecting the UK housing market. We can include the war in Ukraine, inflation, recession fears, and now banking panics. Rightmove reports that many new sellers are being more cautious with their pricing.
The UK housing market has shown itself to be highly resilient. At this time, house prices are much more stable than analysts predicted.
Clearly, we can’t predict the performance of the UK housing market in 2023. After all, there is great economic uncertainty in most of the world.
But still, the housing market could escape a crash with mortgage rates falling and property in short supply.
What is the latest data on House Prices in the UK?
The latest UK House Price index shows the regional differences in house prices. In England, the average house price grew by 6.9% over the 12 months to January 2023. The North East Region and West Midlands had the highest growth at over 9% from January 2022 to January 2023.
Halifax data show house prices increased by 2.2% in February, following a minor increase of 0.2% in January. And this is definitive proof of the market performance because it is based on completed sales.
Rightmove reported that the average price of a new property going out on the market increased by 0.8% in March. Historically asking prices grew by 1% percent on average, which aligns with a more cautious seller sentiment.
What are the main drivers behind UK’s house price stability
Mortgage rates and availability from lenders influence house price growth.
According to Moneyfacts, mortgage rates available on new deals are now closer to 4 percent. This is after hitting 6.52 percent in September after the previous government mini-Budget.
In response to the mini-budget, lenders reacted by removing certain products. Together with conducting more thorough assessments of borrowers’ capacity to pay back their loans. As a result, obtaining a mortgage became quite challenging for buyers. Even if they earned a large monthly income and had an excellent credit rating.
The Bank of England’s decision to increase interest rates again in March adds pressure on lenders to raise mortgage rates. In the short term, there could be an increase in the demand for houses. Because families keen to buy a home might rush to take advantage of current mortgage deals before they’re gone.
On the supply side, affordable remortgage options may be available to households when their current deal is up for revision. This could prevent them from having to sell or face repossession of their property. Consequently, this will avoid the panic selling we saw in 2008, which created an offer rush that crashed the market.
Despite the rise in mortgage rates, the majority of households are expected to handle the increased expenses. Avoiding a massive effect of borrowers falling behind on their monthly mortgage payments.
A strong labour market and the housing supply and demand imbalance in the UK support house prices.
The UK housing market has shown itself to be highly resilient. House prices are much more stable than many analysts expected. Partly due to a strong labour market and the shortage of new housing needed to house a year-on-year growing population.
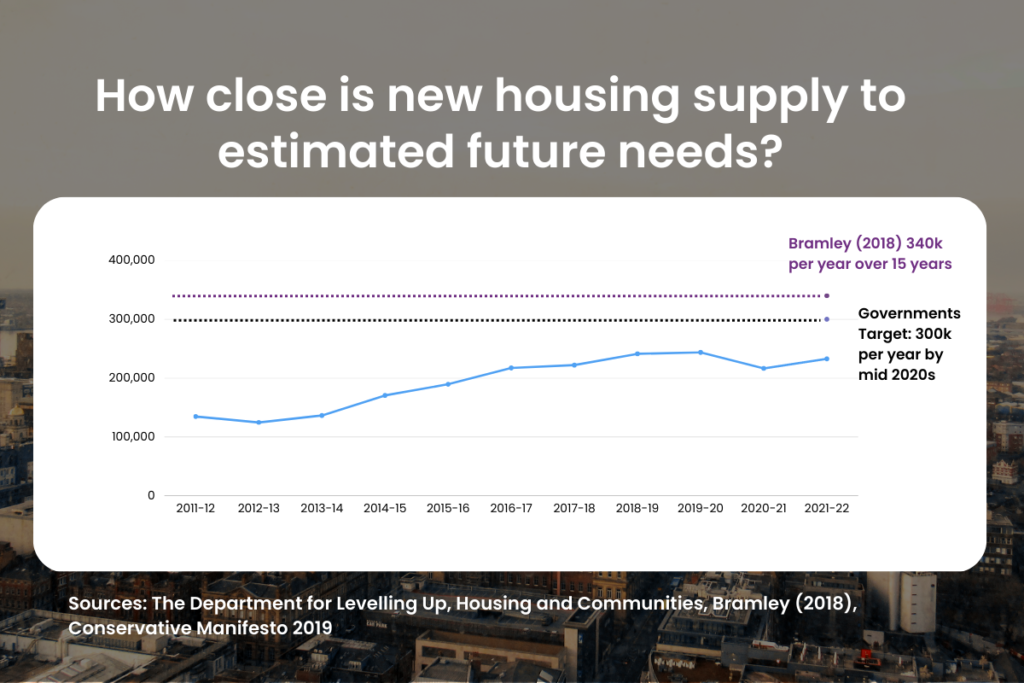
The new housing supply in the UK is currently lower than the Government’s ambition of 300,000 new homes per year.
In the year 2020-2021, only 216,000 new homes were supplied because of disruptions caused by the Covid-19 pandemic.
The National Housing Federation report by Glen Bramley estimated that there was a need for 340,000 new housing a year for over 15 years in England to account for the backlog of housing.
The net housing supply series measure the total increase in the number of homes each year. It factors gains from conversions and change-of-use as well as new-build.
How can CrowdToLive® business model lower the risks of residential property investment and generate higher returns?
CrowdToLive® offers an innovative property investment service that allows investors to invest in the UK housing market without the hassle and costs of traditional Buy-To-Let investments.
We filter the best investment opportunities.
Investors can invest in a specific property or portfolio of properties based on their preferences and investment goals. The investment amount is then divided into shares, with each share representing a percentage of ownership in the property.
Investors receive stable passive income.
Home buyers pay rent on the percentage of the property they do not own. Investors receive rental income in proportion to their ownership. This means that investors receive a regular passive income stream without the need to manage the property themselves.
We take care of property management.
Through CrowdToLive®, investors can avoid the excessive costs and reduced profits linked to tasks such as sourcing properties, managing repairs, selecting tenants, and collecting rent.
CrowdToLive® operates the investment by gathering contributions from various investors to acquire a residential property. The property is occupied by the buyer while being expertly managed by Elite Operations Limited – our in-house property management firm.
CrowdToLive® carefully selects properties that meet strict investment criteria. We only invest in freehold conventional build properties. In order to guarantee optimal investments, we perform a series of evaluations. These include a RICS Level 2 survey with valuation, Property Searches, and Electrical and Gas checks.
Our selection process guarantee that our properties have strong potential for capital appreciation and generate between 5% and 7% Annual NET Yield.
CrowdToLive®’s investment model also includes strict due diligence and screening when selecting home buyers who apply for home finance. Home buyers must pass our screening process to verify their income and credit history. Also, their monthly rent payments can’t exceed 33% of their monthly income.
If you want to learn more about how to create a stable and diversified portfolio through property investment. Contact us about shared property investment opportunities.
Please click here to arrange a free, no-obligation call. Our friendly team will be happy to help.